Documentation
Everything you need to know to get from raw lines to confident picks.
Getting started
Head to the dashboard and pick a league in the left sidebar — MLB, WNBA, World Cup, Tennis, NBA, NHL, or Soccer. Leagues that are out of season are grouped separately and re-activate automatically when play resumes. The badge next to each league shows how many props are live right now.
The main navigation gives you Dashboard, Props, +EV (beta), Players, Saved Picks, Builder, and Settings. Use the search bar at the top to jump straight to any player or team.
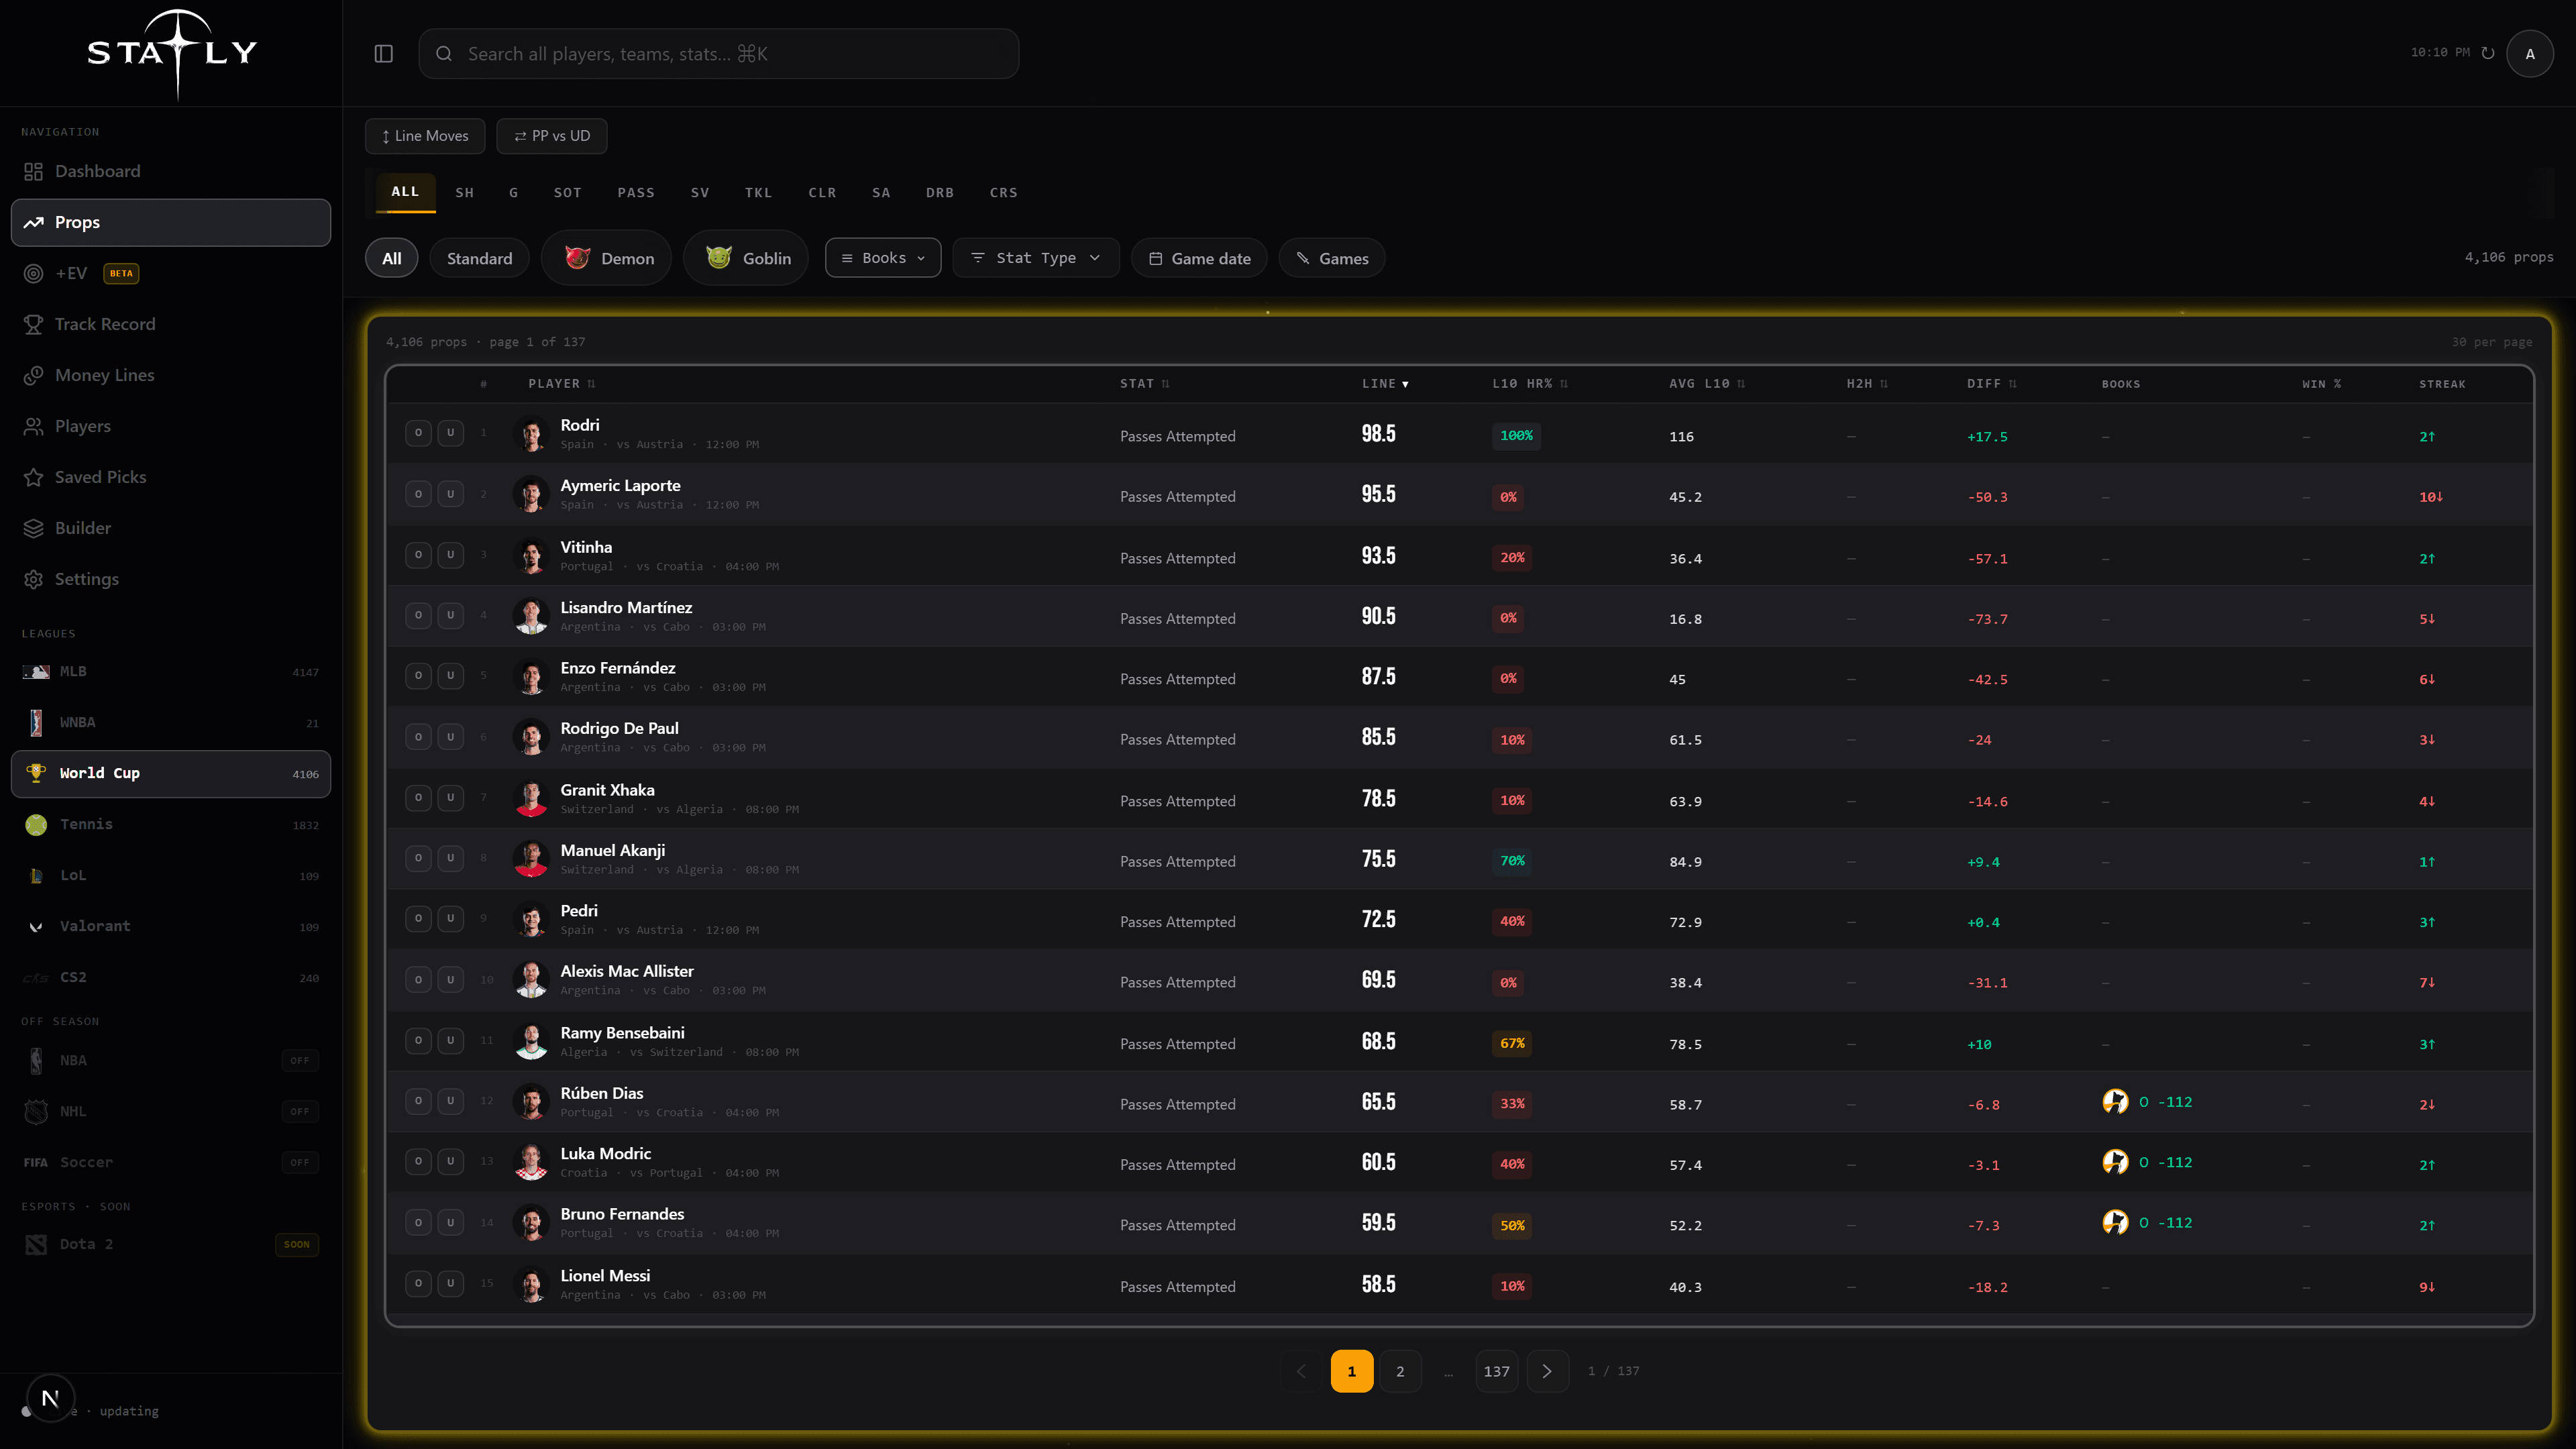
The props table
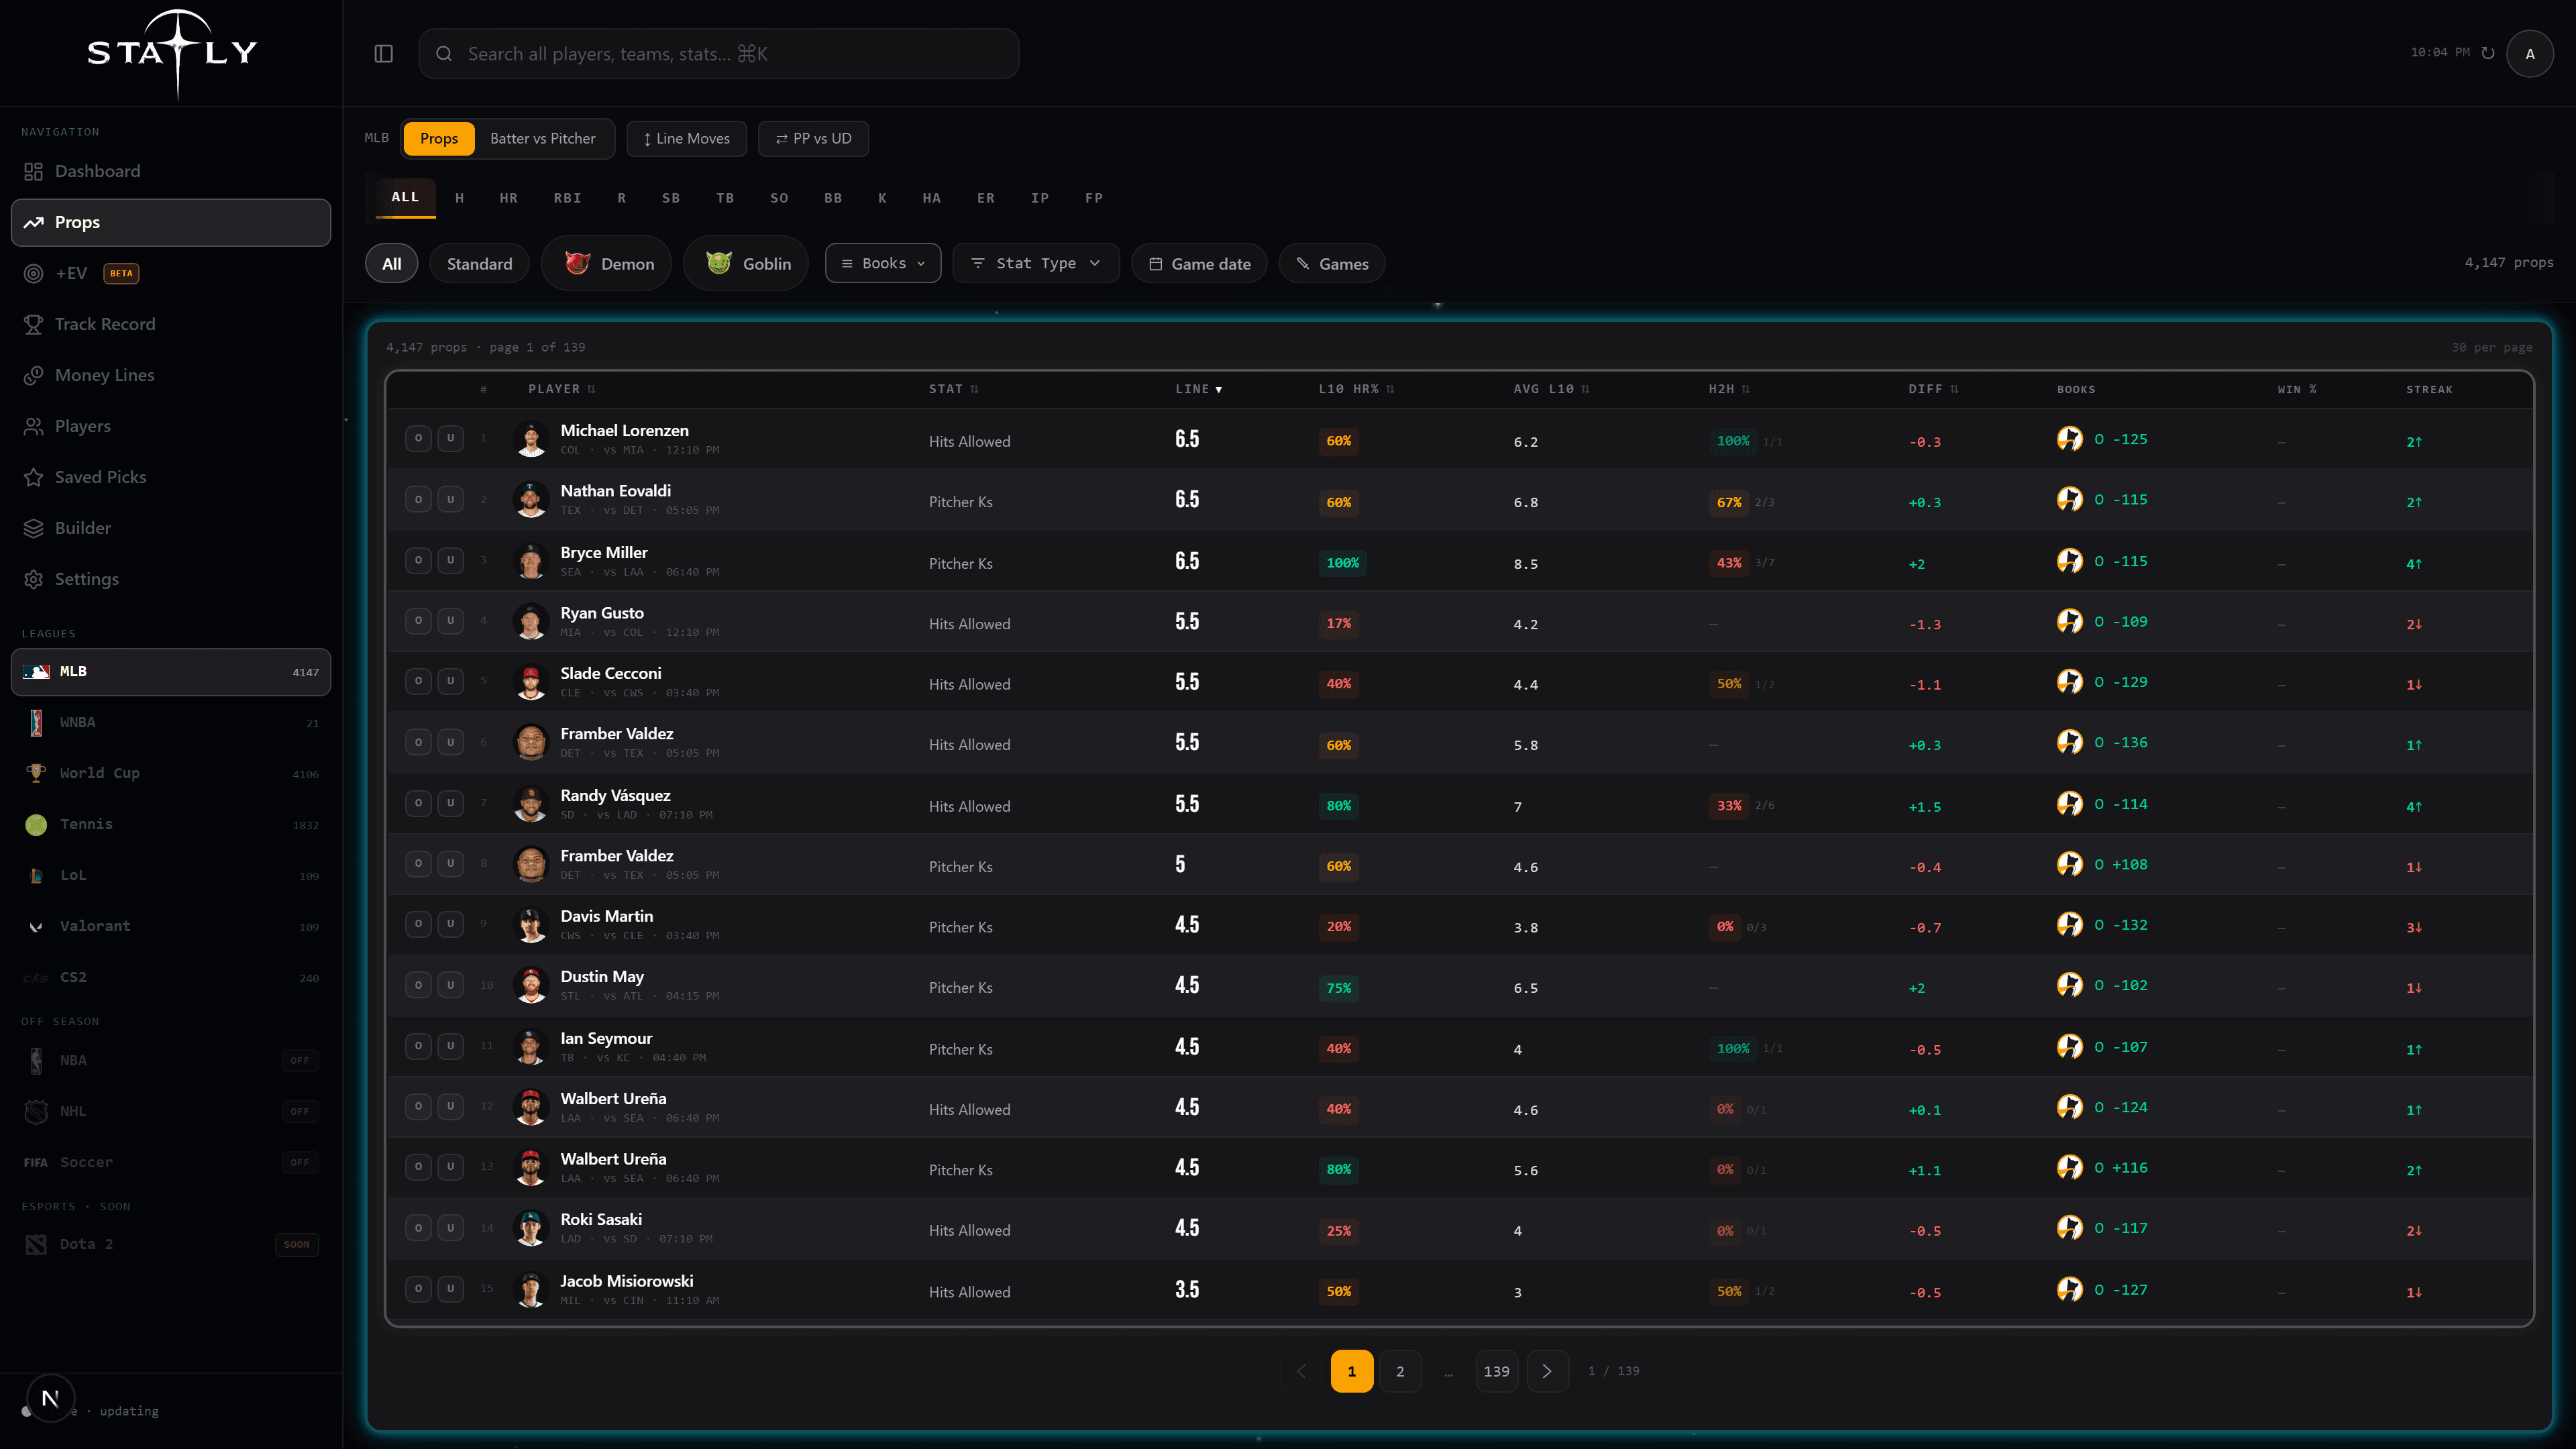
Each row is one player prop. The columns:
- LINE — the current prop line for that stat.
- L10 HR% — how often the player cleared this line in their last 10 games.
- AVG L10 — the player's average for this stat over their last 10 games.
- H2H — hit rate against tonight's specific opponent.
- DIFF — the gap between the player's recent average and the line — positive means they've been beating it.
- BOOKS — live sportsbook odds for the over/under on this line.
- WIN % — model win probability for the over and under.
- STREAK — how many games in a row the player has gone over (or under).
Click any column header to sort, and click a row to open the full player card. The star on the left of a row saves the pick.
Filters
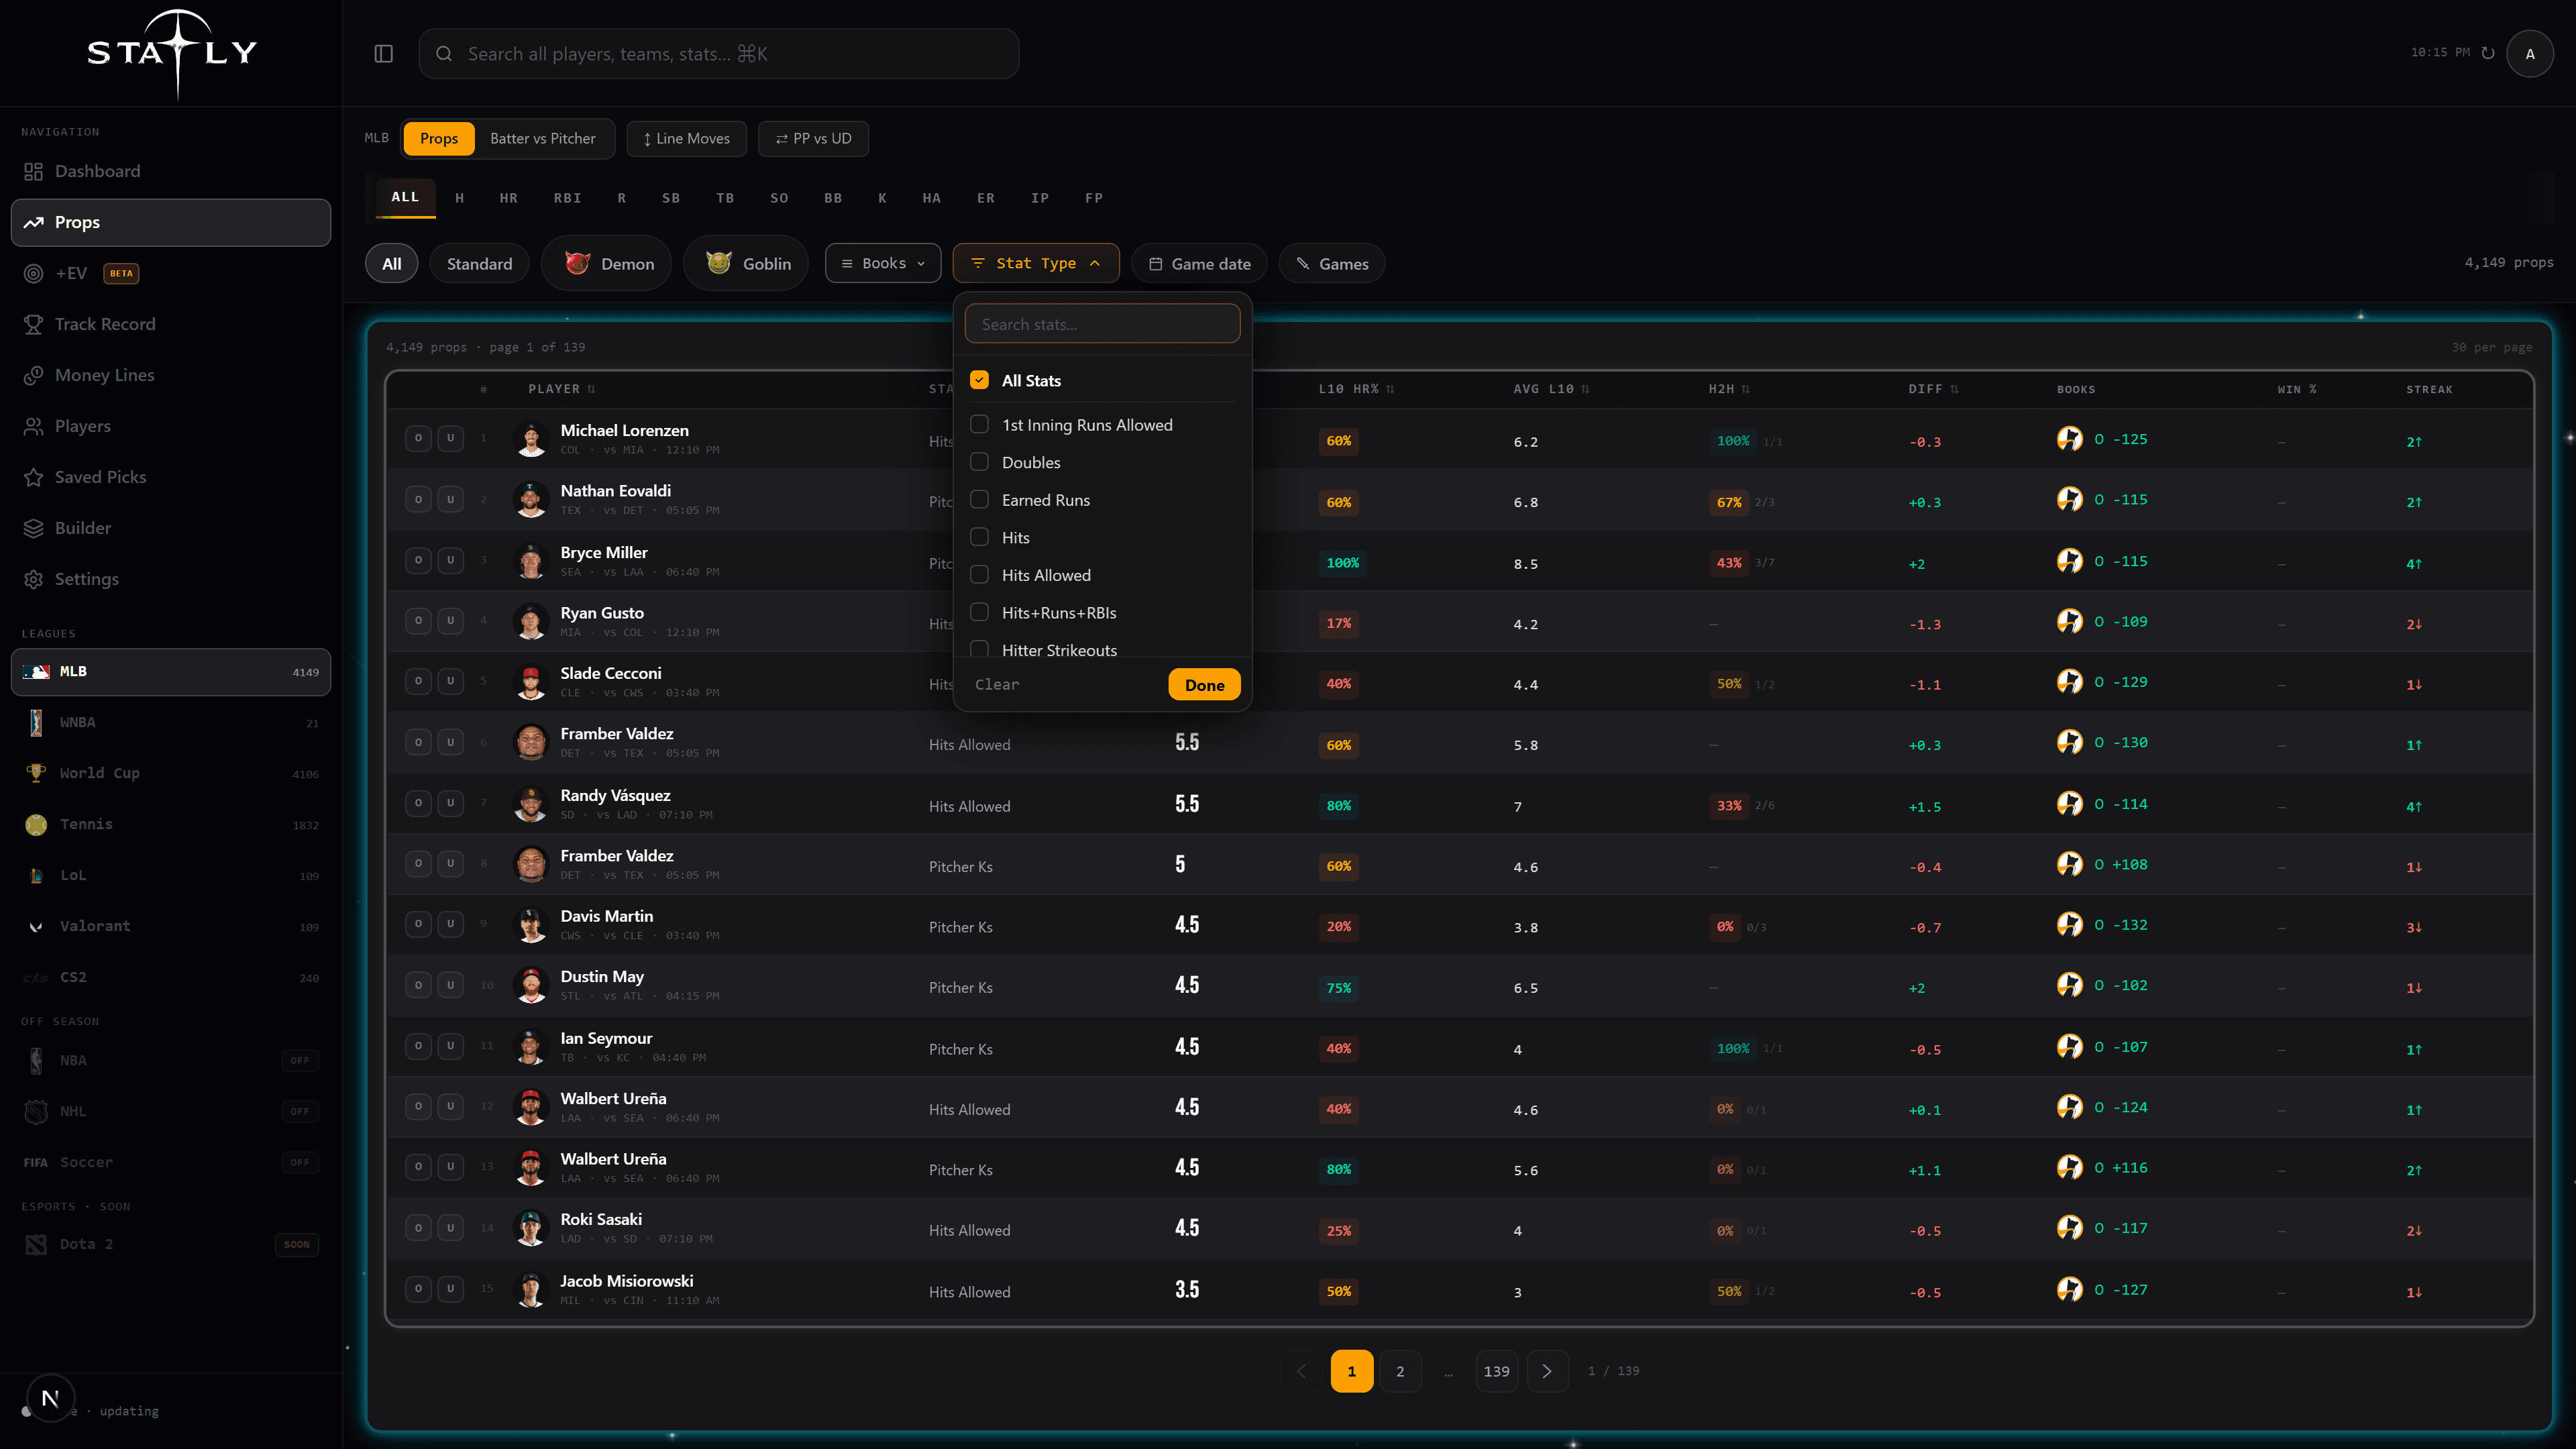
- Stat tabs — the row of stat types across the top (hits, strikeouts, points, and so on) filters the table to one market.
- Standard / Demon / Goblin — PrizePicks line flavors — Demons pay more but are set high, Goblins pay less but are set low.
- Books — show only props available on the sportsbooks you use.
- Stat type — group related markets together.
- Game date — filter to a specific slate.
- Games — narrow the table to specific matchups.
The player card
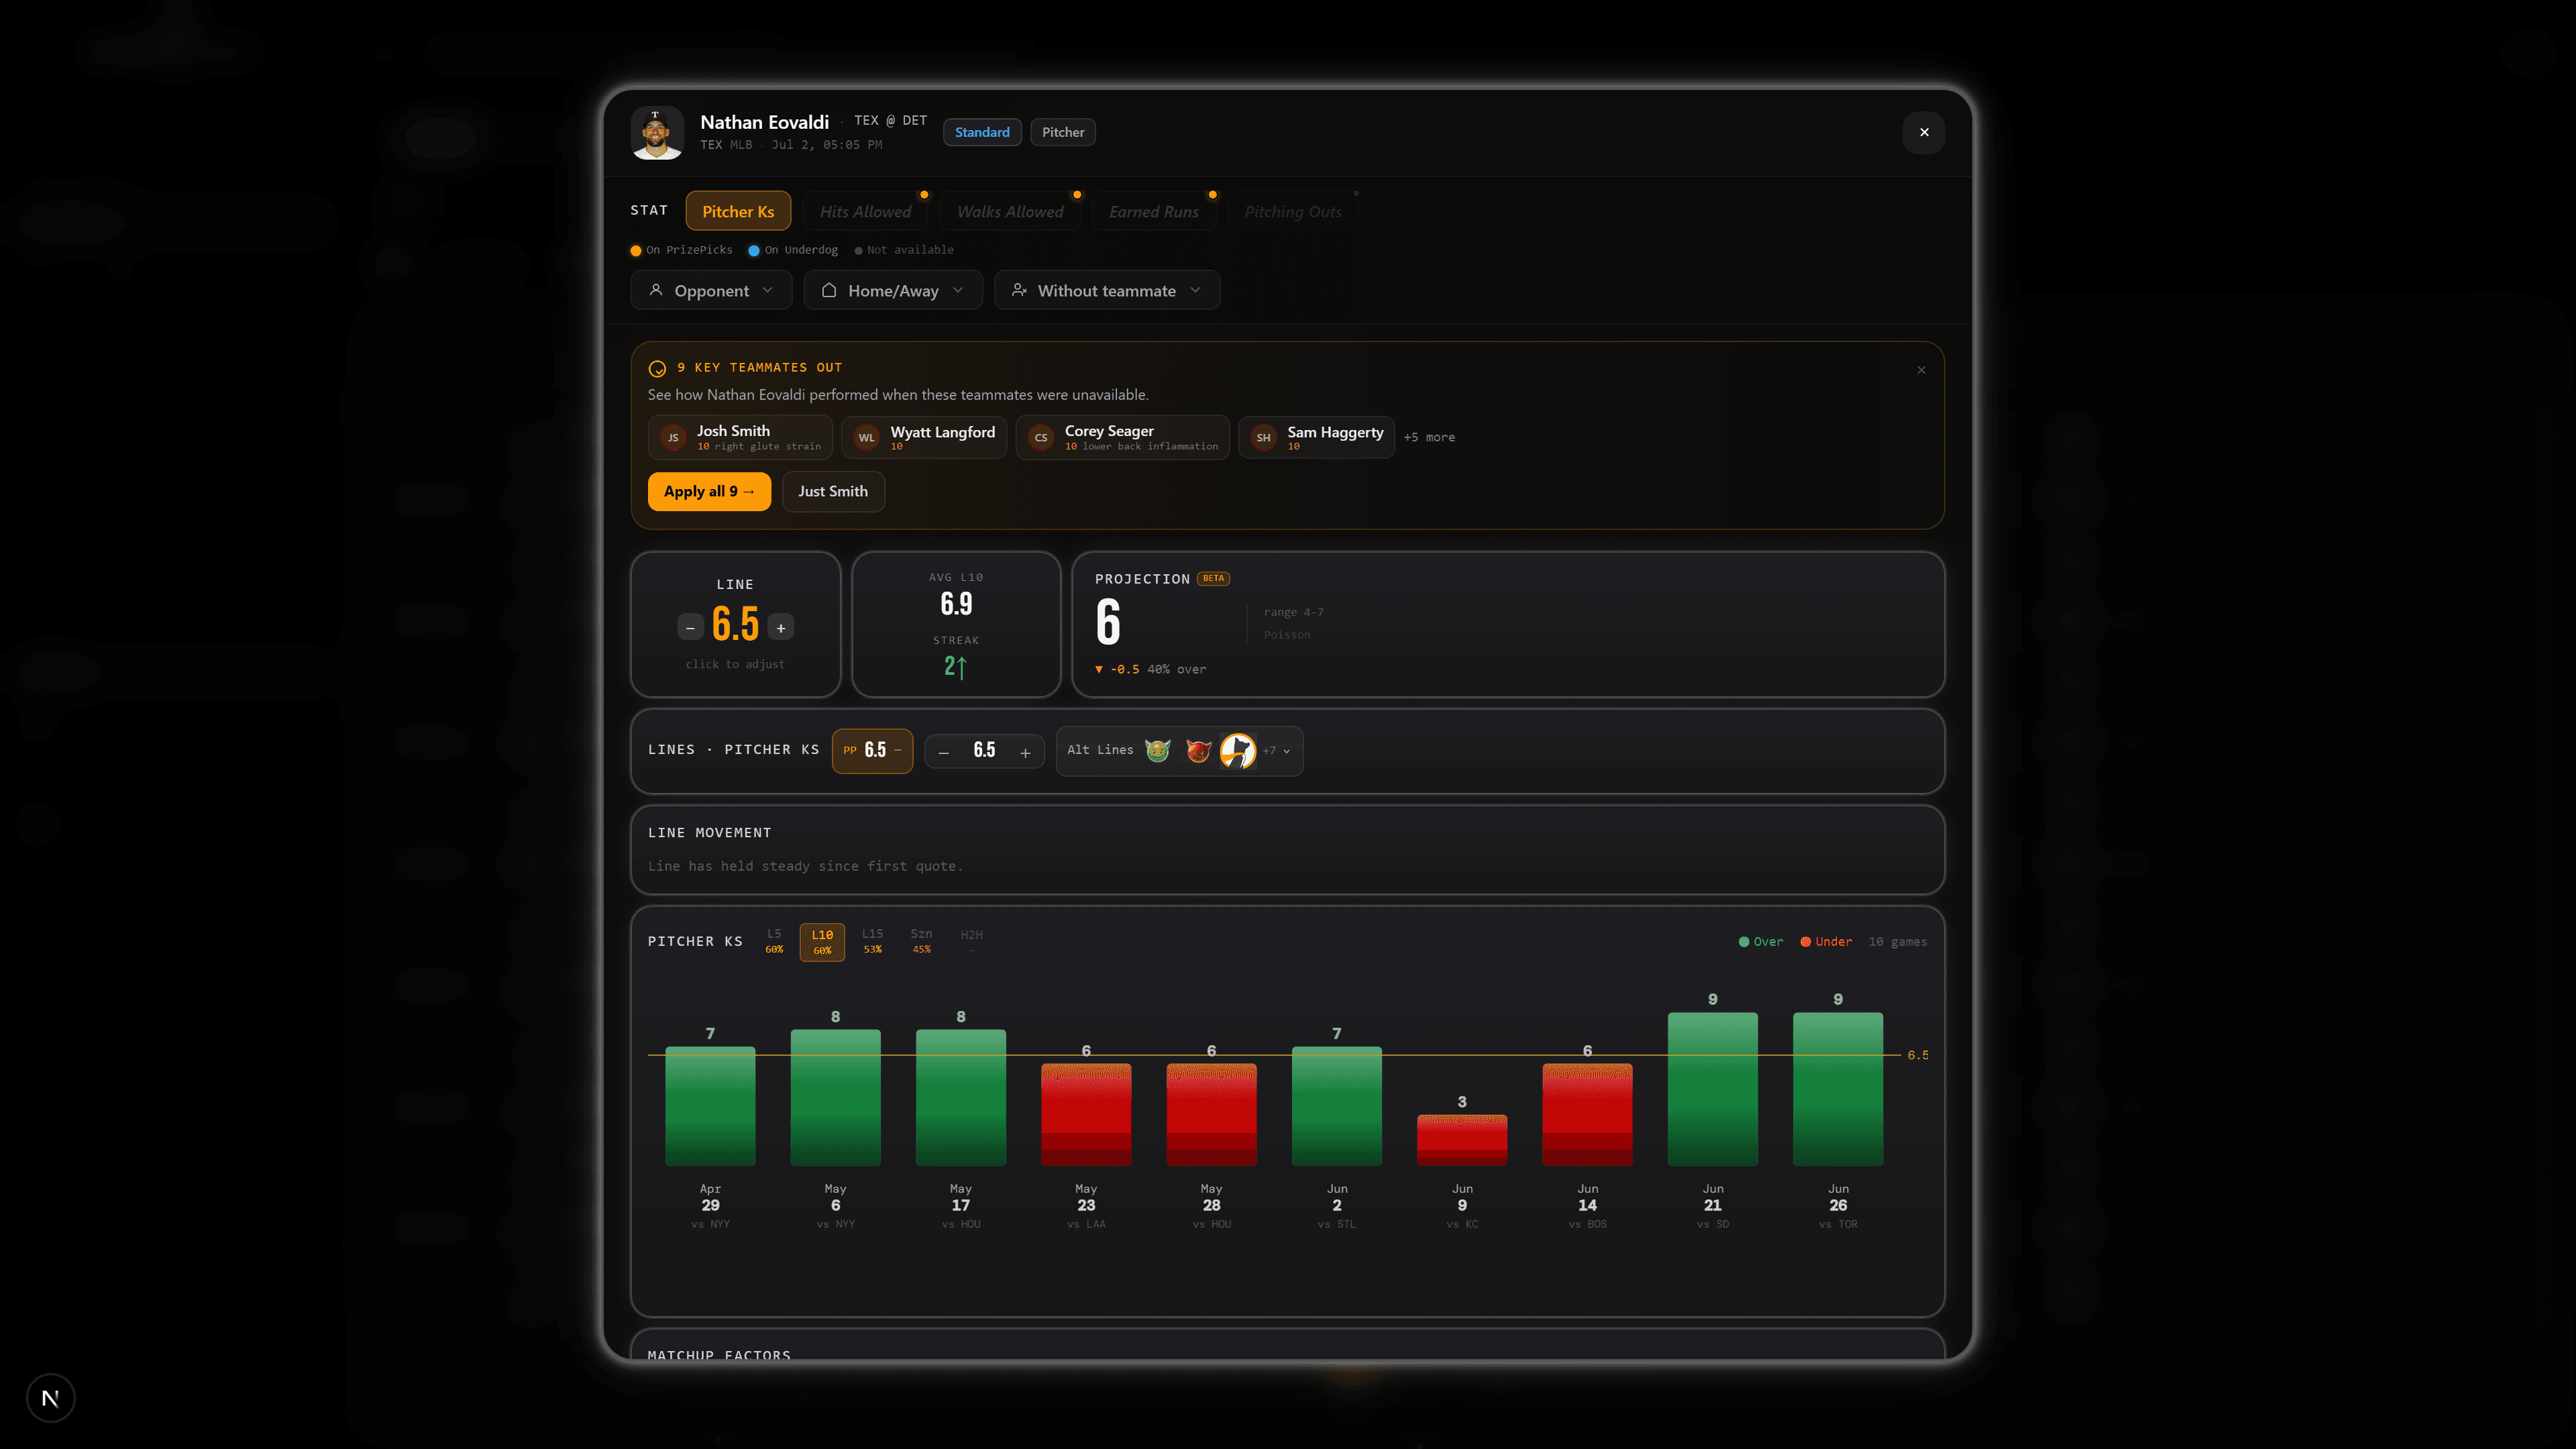
Click a player to open their card. The headline number is the line — use the +/− stepper to adjust it and every hit rate recalculates instantly, so you can test alternate lines.
- Hit-rate chart — green/red bars for each recent game, over or under the line, across L5 / L10 / L25 / season windows.
- Hit-rate tiles — L5, L10, L25 and season hit percentages at a glance, plus average and streak.
- Key teammates out — see how the player performed historically when specific teammates didn't play, and apply those filters to the chart.
- Win probability — model probabilities for tonight's game.
- Lineup & opponent — confirmed lineups, opposing pitcher (MLB), team standings and head-to-head comparison.
- Splits — filter every number by opponent, season, home/away, or with/without a teammate.
+EV finder (beta)
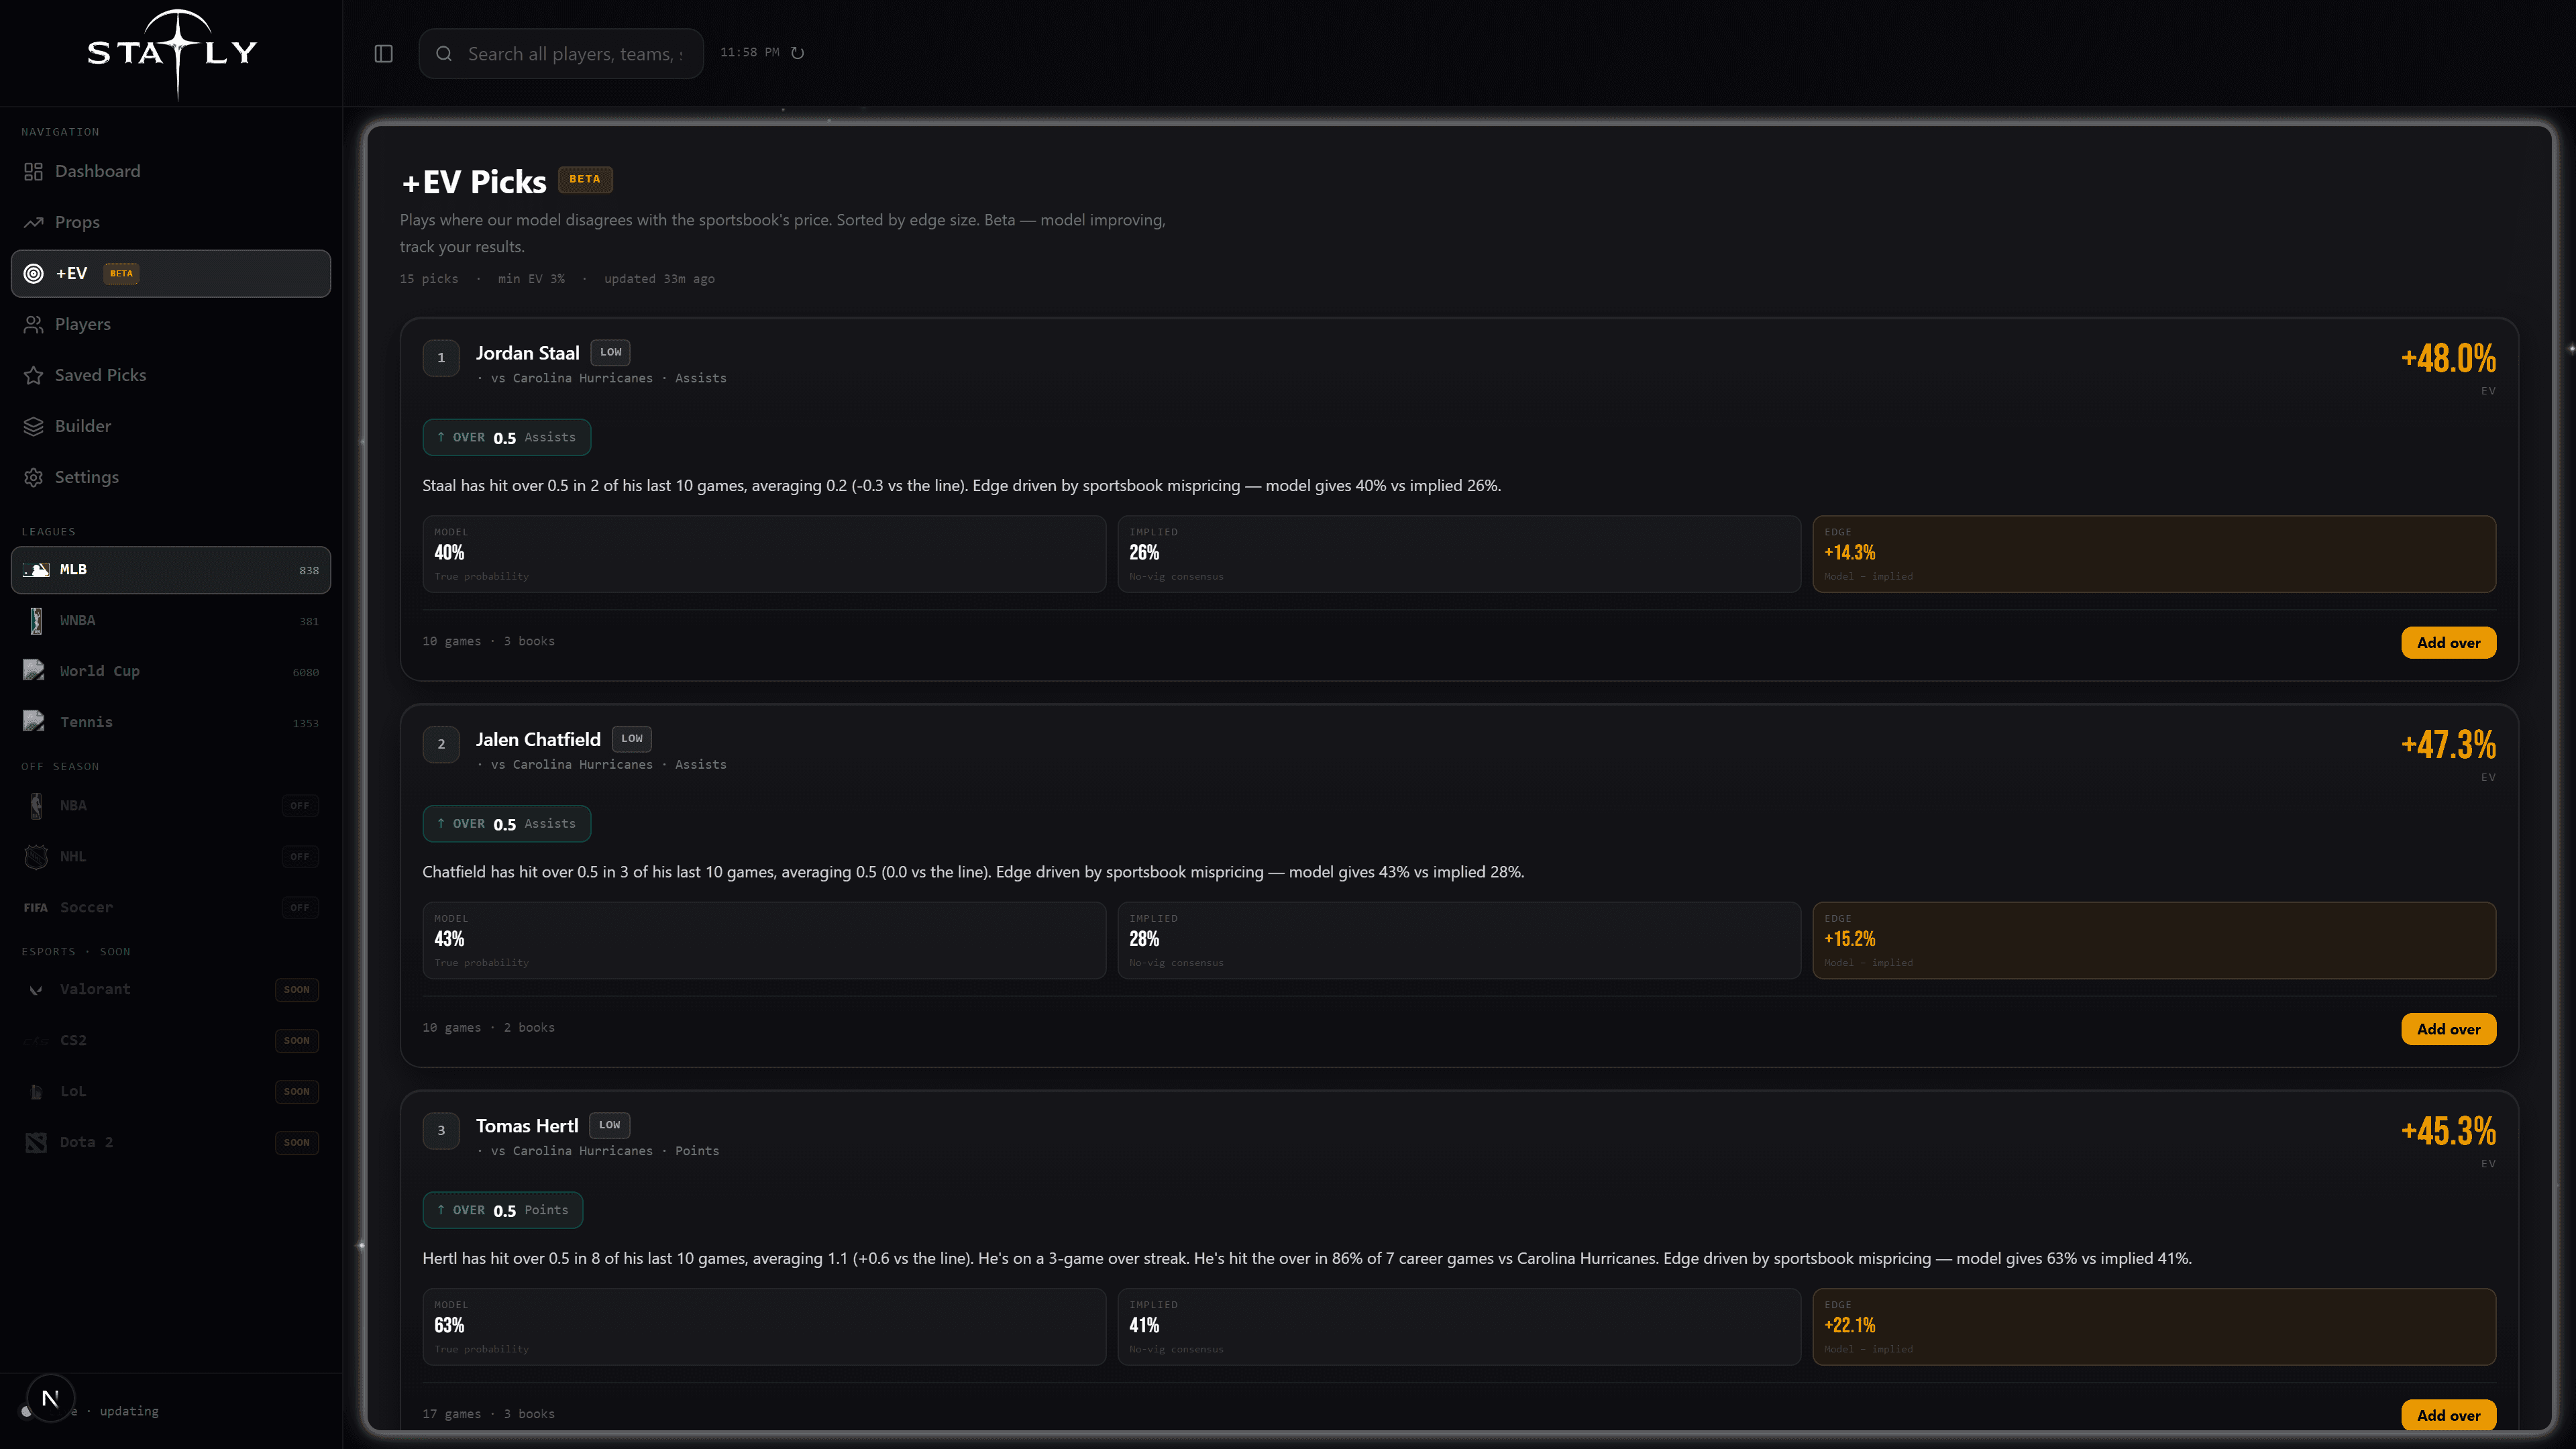
The +EV tab compares Statly's win probabilities against live sportsbook odds and surfaces plays where the odds pay better than the true chance of hitting — positive expected value. Sort by EV to see the strongest edges first. It's in beta, so treat it as a research starting point rather than a verdict.
Saved picks & builder
Star any prop to add it to Saved Picks. The drawer keeps your picks organized per slate and tracks how they performed. The Builder lets you assemble a slip from your saved picks and review its combined hit history before you commit to it anywhere.
World Cup tab
The World Cup league gets extra cards: match win probability, side-by-side country comparison, opponent profiles, and starter badges on players confirmed in the XI. Props filter by game date and matchup like every other league.
Data & refresh schedule
Game logs, rosters, and lines come from official league stat feeds and major sportsbooks. Everything refreshes automatically every day, and prop lines update throughout the day as books move. The footer of the sidebar shows when the current league last updated.